Netflow Visualization with Logstash netflow module
Netflow Visualization
Logstash netflow module を使うことで、収集、正規化(使いやすい形にする)、可視化まで全部やってくれるのでさらに簡単になりました。
The Logstash Netflow module simplifies the collection, normalization, and visualization of network flow data Netflow module
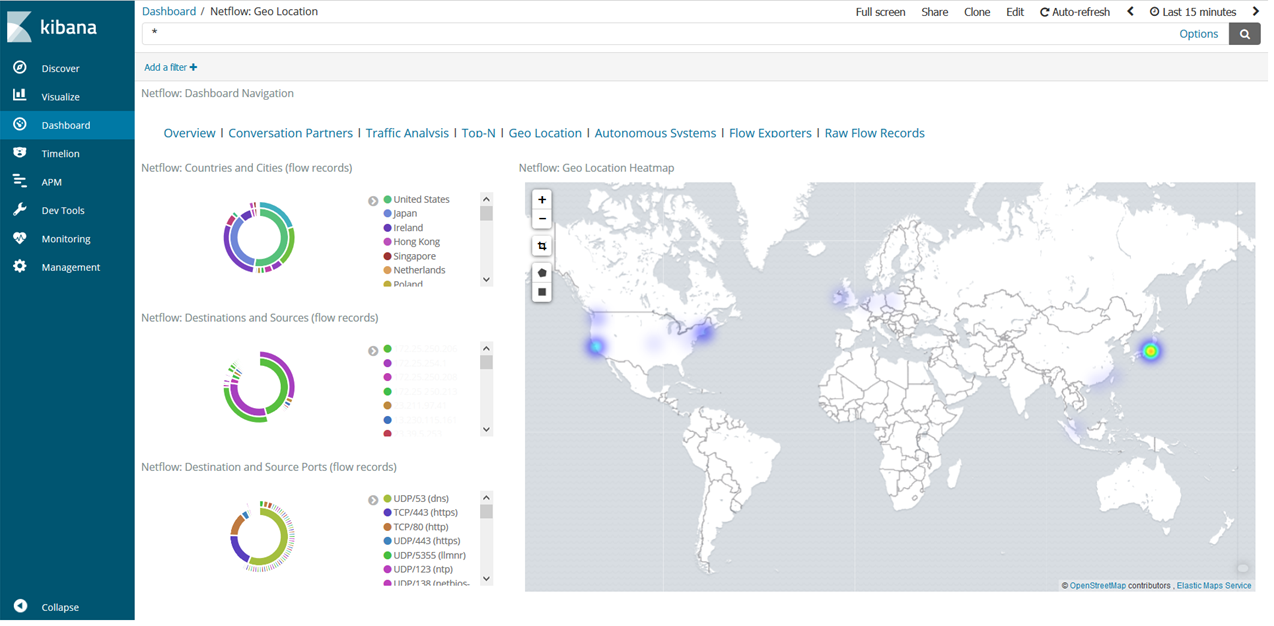
ダッシュボードイメージ
バージョンは、ELK 5.6 以上が必要になります。
Requirements These instructions assume you have already installed Elastic Stack (Logstash, Elasticsearch, and Kibana) version 5.6 or higher. The products you need are available to download and easy to install.
以前(5.5の時に検証)は設定を理解するのが難しいのと可視化ダッシュボードの作成が必要でした。
環境(components)
| components | description |
|---|---|
| elasticsearch | search engine |
| kibana | dashboard |
| logstash | netflow collector |
| nginx (optional) | reverse proxy (restricting access with HTTP Basic Authentication on kibana) * id/pass: elastic/changeme |
Tested version
- kibana / elasticsearch : 6.3.1 and 6.5.1
- logstash : 6.3.1
- CentOS7
デプロイ
細かい手順は、GitHubに書きました。
Enable logstash netflow module
Logstash で netflow module を有効にするには logstash の起動オプション と logstash.yml を編集します。
- Logstash Netflow Module https://www.elastic.co/guide/en/logstash/current/netflow-module.html
Dockerコンテナとしてデプロイする場合は logstash の 起動シェルにオプションを付与します。 udp.port はデフォルトで 2055 ですがオプションの備忘録的に明示的に記載しています。
./dockerfiles/logstash/run.sh
#!/bin/bash

LS_LOG=/var/log/logstash/logstash-plain.log
su - logstash -s /bin/bash -c \
    "export JAVA_HOME=/etc/alternatives/jre_openjdk;export PATH=$PATH:$HOME/bin:$JAVA_HOME/bin;/usr/share/logstash/bin/logstash --setup -M netflow.var.input.udp.port=2055 --path.settings /etc/logstash" &
su - logstash -s /bin/bash -c \
    "test -e ${LS_LOG} || touch ${LS_LOG}"
tail -f ${LS_LOG}
./dockerfiles/logstash/logstash.yml
path.data: /var/lib/logstash
path.logs: /var/log/logstash
modules:
  - name: netflow
    var.input.udp.port: 2055
    var.elasticsearch.hosts: "elasticsearch:9200"
    var.kibana.host: "kibana:5601"